Introduction
This tutorial shows how to use Microsoft Chart Controls for .NET Framework in a SharePoint web site. I will post soon a new tutorial that will show how to integrate a chart in a SharePoint Web Part in order to configure the Chart Control through the Web Part Tool Pane. This tutorial is compliant both with MOSS and Windows SharePoint Services.
1 - Prerequisites
- Microsoft Chart Controls for Microsoft .NET Framework 3.5 are installed on the development environment. You can download installation package here
- Microsoft Visual Studio 2008 is installed on the development environment.
- Microsoft Chart Controls Add-on for Microsoft Visual Studio 2008 is installed on the development environment. You can download it here .
- Samples Environment for Microsoft Chart Controls are installed on the development environment. If not you can download them here.

2 - Tutorial Overview
This tutorial presents the following operations:
- Creating a asp .net Web Site and an in line script .aspx page to test a Chart Control.
- Creating a SharePoint team Site where the previous aspx page will be deployed.
- Copy the Web Samples images under the SharePoint 12 hive.
- Modify the SharePoint site Web Application config file in order to make the chart controls to be usable in the SharePoint site.
- Deploy the .aspx page in the SharePoint site and test it.
3 - Tutorial
3.1 Creating a asp .net Web Site and an in line script .aspx page to test a Chart Controls.
First create a web site project with Visual Studio 2008. Add a new Web Form to your web site and choose to put server code in line.
Asume you call it MsChartControlForSharePoint.aspx
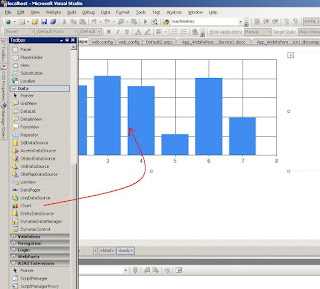
Then view your page in desgin mode and drag and drop a Chart control from the Tool Box of Visual Studio to your page.

Then put the following server script in your page
    <script runat="server">
        protected void Page_Load(object sender, EventArgs e)
        {
            // Create new data series and set it's visual attributes
            Series series = new Series("Spline");
            series.ChartType = SeriesChartType.Spline;
            series.BorderWidth = 3;
            series.ShadowOffset = 2;
            // Populate new series with data
            series.Points.AddY(67);
            series.Points.AddY(57);
            series.Points.AddY(83);
            series.Points.AddY(23);
            series.Points.AddY(70);
            series.Points.AddY(60);
            series.Points.AddY(90);
            series.Points.AddY(20);
            // Add series into the chart's series collection
            Chart1.Series.Add(series);
        }
    </script>
here is the MsChartControlForSharePoint.aspx page complete code:
 <%@ Page Language="C#" %>
 <%@ Register Assembly="System.Web.DataVisualization, Version=3.5.0.0, Culture=neutral, PublicKeyToken=31bf3856ad364e35"
    Namespace="System.Web.UI.DataVisualization.Charting" TagPrefix="asp" %>
 <%@ Import Namespace="System.Web.UI.DataVisualization.Charting" %>
<!DOCTYPE html PUBLIC "-//W3C//DTD XHTML 1.0 Transitional//EN" "http://www.w3.org/TR/xhtml1/DTD/xhtml1-transitional.dtd">
<html xmlns="http://www.w3.org/1999/xhtml">
<head id="Head1" runat="server">
    <title></title>

    <script runat="server">
        protected void Page_Load(object sender, EventArgs e)
        {
            // Create new data series and set it's visual attributes
            Series series = new Series("Spline");
            series.ChartType = SeriesChartType.Spline;
            series.BorderWidth = 3;
            series.ShadowOffset = 2;

            // Populate new series with data
            series.Points.AddY(67);
            series.Points.AddY(57);
            series.Points.AddY(83);
            series.Points.AddY(23);
            series.Points.AddY(70);
            series.Points.AddY(60);
            series.Points.AddY(90);
            series.Points.AddY(20);

            // Add series into the chart's series collection
            Chart1.Series.Add(series);
        }

    </script>
</head>
<body>
    <form id="form1" runat="server">
    <div>
        <asp:Chart ID="Chart1" runat="server" Width="694px">
            <Series>
                <asp:Series Name="Series1">
                </asp:Series>
            </Series>
            <ChartAreas>
                <asp:ChartArea Name="ChartArea1">
                </asp:ChartArea>
            </ChartAreas>
        </asp:Chart>
    </div>
    </form>
</body>
</html>
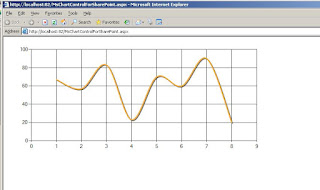
Right click your page and choose "view in browser", you should obtain that result:

3.2 Creating a SharePoint team Site where the previous aspx page will be deployed.
Create a new Sharepoint Web application, then a site collection, and choose "Team Site" as site template.

3.3 Copy the Web Samples images under the SharePoint 12 hive.
Open the file where you unziped Web Samples and locate Images folder. Copy the content of the folder.

Under the 12 hive create a sub-directory "MicrosoftChartControls" in the IMAGES directory. Paste the previously copied images.

3.4 Modify the SharePoint site Web Application config file in order to make the chart controls to be usable in the SharePoint site.
Add a line to SafeControl Section
      <SafeControl Assembly="System.Web.DataVisualization, Version=3.5.0.0, Culture=neutral, PublicKeyToken=31bf3856ad364e35"  Namespace="System.Web.UI.DataVisualization.Charting" TypeName="*" Safe="True" AllowRemoteDesigner="True"/>
    </SafeControls>

Add the path="ChartImg.axd" line to httpHandlers section
    <httpHandlers>
      <remove verb="GET,HEAD,POST" path="*" />
      <add verb="GET,HEAD,POST" path="*" type="Microsoft.SharePoint.ApplicationRuntime.SPHttpHandler, Microsoft.SharePoint, Version=12.0.0.0, Culture=neutral, PublicKeyToken=71e9bce111e9429c" />
      <add verb="OPTIONS,PROPFIND,PUT,LOCK,UNLOCK,MOVE,COPY,GETLIB,PROPPATCH,MKCOL,DELETE,(GETSOURCE),(HEADSOURCE),(POSTSOURCE)" path="*" type="Microsoft.SharePoint.ApplicationRuntime.SPHttpHandler, Microsoft.SharePoint, Version=12.0.0.0, Culture=neutral, PublicKeyToken=71e9bce111e9429c" />
      <add verb="*" path="ChartImg.axd" type="System.Web.UI.DataVisualization.Charting.ChartHttpHandler, System.Web.DataVisualization, Version=3.5.0.0, Culture=neutral, PublicKeyToken=31bf3856ad364e35" validate="false"/>
    </httpHandlers>

Add a appSettings section
Go to the end of the web.config file and locate the ending tag </System.Workflow.ComponentModel.WorkflowCompiler>. Paste the appSettings section.
    </System.Workflow.ComponentModel.WorkflowCompiler>
    <appSettings>
      <add key="ChartImageHandler" value="storage=memory;timeout=20;URL=/_layouts/Images/MicrosoftChartControls/" />
    </appSettings>

As we are going to deploy the MsChartControlForSharePoint.aspx page in the Shared Document library of the SharePoint site , and there is in line code in it, we have to modify again the web.config in order to allow in line script to be executed in that page. Of course this is just for a matter of demonstration and is not a best practice at all. I will publish soon a post in order to deploy the control inside a Web Part.
Locate the "PageParserPaths" section and paste the "PageParserPath" line.
  <SharePoint>
    <SafeMode MaxControls="200" CallStack="false" DirectFileDependencies="10" TotalFileDependencies="50" AllowPageLevelTrace="false">
      <PageParserPaths>
          <PageParserPath VirtualPath="/Shared Documents/*" AllowServerSideScript="true" CompilationMode="Always"/>
        </PageParserPaths>
    </SafeMode>

3.5 Deploy the .aspx page in the SharePoint site and test it.
Now we just have to upload the MsChartControlForSharePoint.aspx page in the Shared Document library.


and test it.

4 - Related Links
You can find additional information at:
Thanks to Alex Gorev for having referenced this post.


11 comments:
Hi,
How can i make this run with a non-administrative user? This needs administrative privileges..I'm stuck with this..
Thanks..
Hi,
I checked and actually had the same issue ( I guess you had an HTTP Error 403 ). This error is due to the fact that the application tries to write on the directory where are stored Chart Controls Images.
\12\TEMPLATE\IMAGES\MicrosoftChartControls
This issue occurs at the chart rendering time.
When you execute the control rendering while logged with administrative privileges you have write access to the directory, so no error occurs...
So, to solve this issue, do the following:
go to the directory "MicrosoftChartControl" add the group and set security for the directory.
-Add Users group (SeverName\Users)
-Give it the Write permission.
I found another solution;
Instead of using "storage=file" mode, i switched ChartHttpHandler appSetting into the "storage=memory" mode.
Thanks Marc for quick reply..
Regards,
Thank you,
Good point !
I will modify my post code sample to take this in account.
Thx a lot Marc...I mean your post/tutorial has been more than helpfully to me - since I am a beginner that is trying to expand his knowledge about asp.net....I really appreciate the time you took to make that post/tutorial..thx again..
You 're welcome Erik. I hope you will be soon as experimented in Asp .Net as in Team System ;-)
This page has encountered a critical error. Contact your system administrator if this problem persists. what shuld i do in this case.
miThis page has encountered a critical error. Contact your system administrator if this problem persists. what shuld i do in this case.
Hi Marc,
Thanks for the posting. I found it quite interesting. I have a little issue though. I have followed all the instructions, including the settings for the web config file at the application level. However, when I upload the aspx page in Shared Documents in the SharePoint site, I am getting the following error:
"The codefile attribute on the page directive is not allowed in this page. "
Any ideas that you can kindly provide will be highly appreciated.
Thanks.
Marc, Thanks for this excellent blog. I tried to use the BackImage property. But I am not sure where to place the images so that chart can pick it for generating the final chart. I tried every possible locations I believe - like 12 hive, sharepoint bin, templates folder, images folder, temp folder, full url, partial url. All failed. Can you help me here?
You saved my day! Thx vry much!
Post a Comment